The ecommerce industry has seen tremendous growth over the past decade. However, the post-pandemic world poses new challenges that threaten this progress. Reduced consumer confidence, high inflation, supply chain disruptions, and other factors have resulted in the first period of negative growth for ecommerce in years (Figure 1).
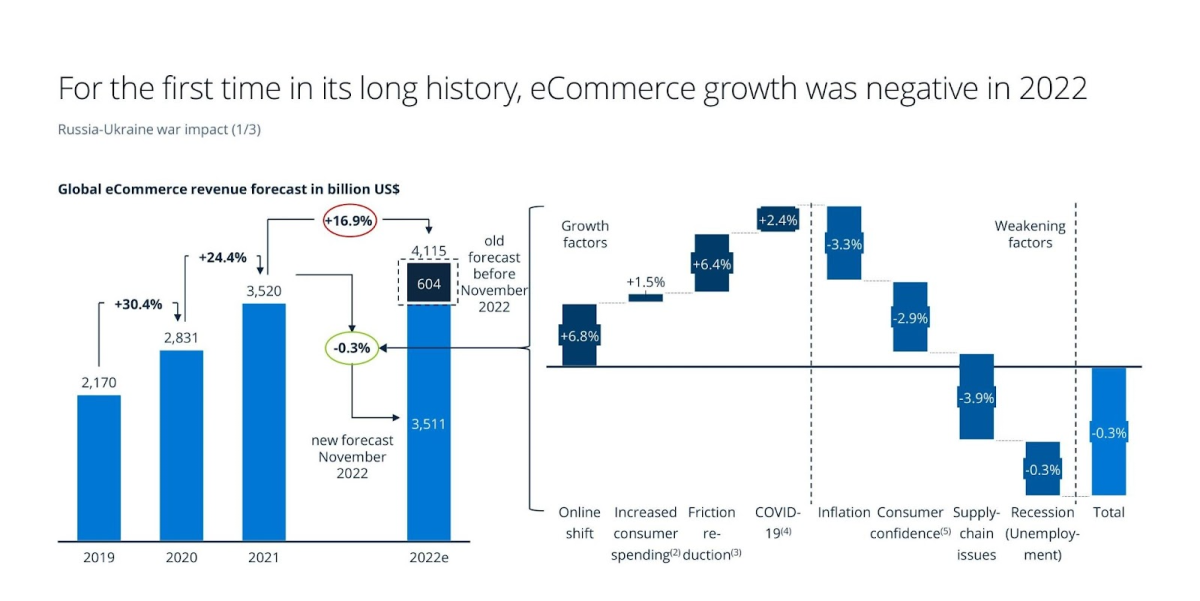
Figure 1: Factors that resulted in negative growth in the ecommerce sector
In addition, as Figure 2 shows, consumer spending is shifting away from online shopping toward travel, offline shopping, and other areas.
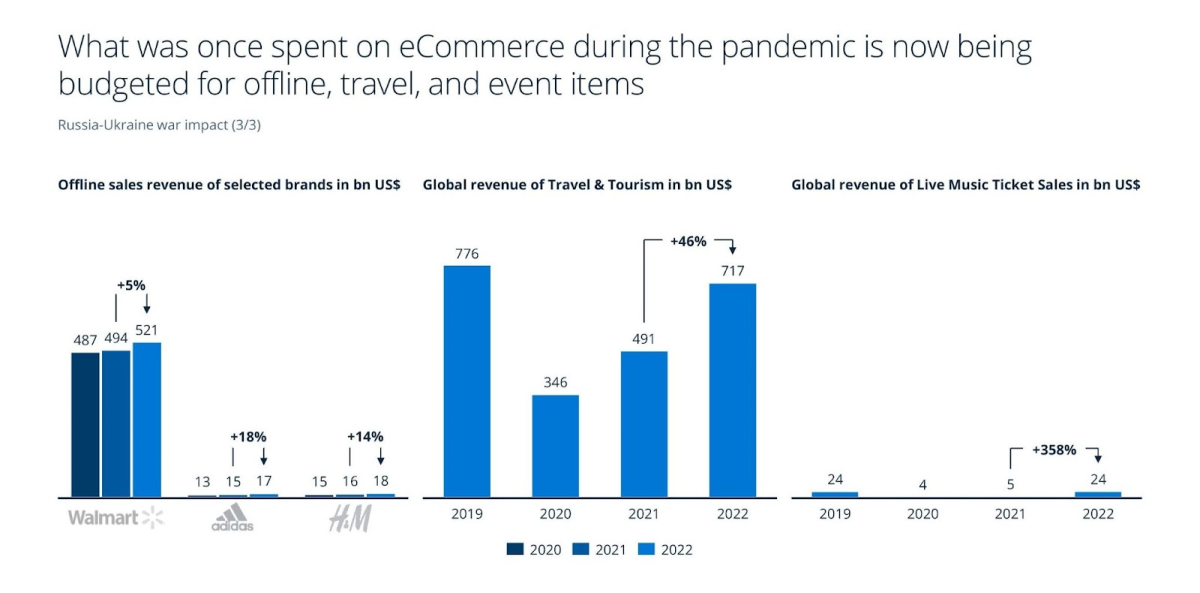
Figure 2: The focus of consumer spending changes
To thrive in this challenging business environment, ecommerce companies must closely monitor their performance and rapidly respond to issues. This is where key performance indicators (KPIs) become invaluable.
This guide will explore:
- What are ecommerce KPIs and why are they crucial?
- The challenges of tracking ecommerce KPIs
- Top 18 ecommerce KPIs to track in 2024
- How an ecommerce analytics platform can help manage KPIs
- Conclusion and further reading
What are ecommerce KPIs?
Ecommerce KPIs are measurable values that help online businesses track, evaluate, and optimize their performance over time. By setting specific targets and monitoring progress, KPIs enable ecommerce companies to identify areas for improvement and make data-driven decisions to achieve their goals.
Why is tracking KPIs crucial for ecommerce businesses?
Tracking KPIs is vital for ecommerce businesses for several reasons:
-
Gain insights: KPIs provide insights into the overall health of the business and help identify trends, challenges, and opportunities.
-
Set objectives: KPIs allow businesses to set clear goals and measure progress towards meeting them.
-
Drive growth: The data and insights from KPIs enable companies to improve customer experience, streamline operations, and drive revenue growth.
The challenge of tracking ecommerce KPIs
Despite their importance, tracking KPIs can be challenging:
-
Data overload: The vast amount of data available makes it difficult to focus on the most relevant metrics.
-
Prioritization: With limited resources, businesses must identify and focus on the KPIs that matter most.
-
Internal vs. external data: Internal KPIs are easier to measure as the data is readily available. External data like competitor intelligence is harder to gather due to lack of access and regulations.
-
Evolving business: As the business grows, KPIs must be continually evaluated and updated.
An all-in-one ecommerce analytics platform like Bright Insights can help manage these challenges by tracking the most relevant KPIs and providing consolidated data and insights.
Top 18 ecommerce KPIs to measure business performance
This section highlights 18 of the most important ecommerce KPIs that online retailers should track, divided into external and internal metrics.
External KPIs
External KPIs rely on data from outside the organization and provide insights into the market landscape:
1. Competitor sales growth rate
This metric measures the percentage increase in sales for a competitor over a period of time. It helps benchmark performance.
Example:
Competitor Q1 sales = $500,000
Competitor Q2 sales = $550,000
Sales growth rate = (Q2 sales – Q1 sales)/Q1 sales x 100
= ($550,000 – $500,000)/$500,000 x 100
= 10%
2. Competitor pricing index
This KPI compares your product prices to competitor average prices. It indicates how you are positioned on pricing.
Example:
Your average price for a smartphone = $400
Competitor average price for the same smartphone = $420
Competitor pricing index = Your price/Competitor price x 100
= $400/$420 x 100
= 95.24%
Tools like Bright Insights can automate competitor price monitoring.
Market share is the percentage of total market revenue generated by your business. It measures your market presence and competitiveness.
Example:
Total market revenue = $10 million
Your revenue = $1 million
Market share = Your revenue/Total market revenue x 100
= $1 million/$10 million x 100
= 10%
4. Competitor product assortment
This KPI helps compare your product catalog size and variety versus key competitors. It indicates how well you are meeting customer needs.
Example:
Your catalog has 5,000 products
Top competitor A has 8,000 products
Top competitor B has 10,000 products
This shows your catalog is smaller than competitors, suggesting opportunities to expand product selection.
5. Competitor backlink profile
Analyzing competitor backlinks helps benchmark your SEO efforts against top performers in your market. Strong backlink profiles indicate high domain authority.
Example:
Your website has 500 backlinks
Competitor site has 1,500 backlinks
This indicates your competitors are outperforming in link building, providing an SEO benchmark.
Internal KPIs
Internal metrics rely on data within your organization to assess performance:
6. Conversion rate
Conversion rate is the percentage of website visitors who complete a desired action, like making a purchase. It measures the effectiveness of sales processes.
Example:
Website visitors: 1,000
Purchases: 50
Conversion rate = Purchases/Visitors x 100
= 50/1000 x 100 = 5%
7. Average order value (AOV)
AOV is the average dollar amount spent per order. Higher AOV means more revenue per customer.
Example:
Total revenue = $10,000
Total orders = 100
AOV = Total revenue/Total orders
= $10,000/100 = $100
8. Lifetime value (LTV)
LTV estimates revenue generated from a customer over their lifetime. It helps gauge the long-term value of customers.
Example:
Your data shows an average customer spends $1,000 per year for 5 years.
Average lifetime value = Annual spend x Average customer lifespan
= $1,000 x 5 years
= $5,000
9. Cart abandonment rate
This measures the percentage of visitors who add items to carts but do not complete checkout. It identifies gaps in the purchase process.
Example:
Cart adds: 200
Purchases: 100
Abandonment rate = (Cart adds – Purchases)/Cart adds x 100
= (200 – 100)/200 x 100
= 50%
10. Revenue growth rate
Revenue growth rate tracks the percentage increase in revenue over time. Higher growth indicates greater sales and market penetration.
Example:
January revenue = $50,000
February revenue = $60,000
Revenue growth rate = (Current month revenue – Previous month revenue)/Previous month revenue x 100
= ($60,000 – $50,000)/$50,000 x 100
= 20%
11. Marketing return on investment (ROI)
ROI measures the profitability of marketing efforts. A positive ROI means campaigns generate more revenue than their cost.
Example:
Campaign cost = $5,000
Revenue from campaign = $15,000
ROI = (Revenue – Cost)/Cost x 100
= ($15,000 – $5,000)/$5,000 x 100
= 200%
12. Customer acquisition cost (CAC)
CAC is the average marketing spend to acquire a new customer. Lower CAC means more efficient acquisition.
Example:
Total marketing spend = $10,000
New customers acquired = 200
CAC = Marketing spend/New customers
= $10,000/200
= $50
13. Retention rate
Retention rate is the percentage of customers retained over a period. Higher retention signifies loyalty and satisfaction.
Example:
Total customers start of year: 1,000
Total customers end of year: 800
Retention rate = Retained customers/Starting customers x 100
= 800/1000 x 100
= 80%
14. Churn rate
Churn is the percentage of customers lost during a period. Lower churn means higher retention.
Example:
Starting customers: 1,500
Lost customers: 60
Churn rate = Lost customers/Starting customers x 100
= 60/1500 x 100
= 4%
15. Net Promoter Score (NPS)
NPS measures customer loyalty and satisfaction. Higher scores indicate stronger engagement.
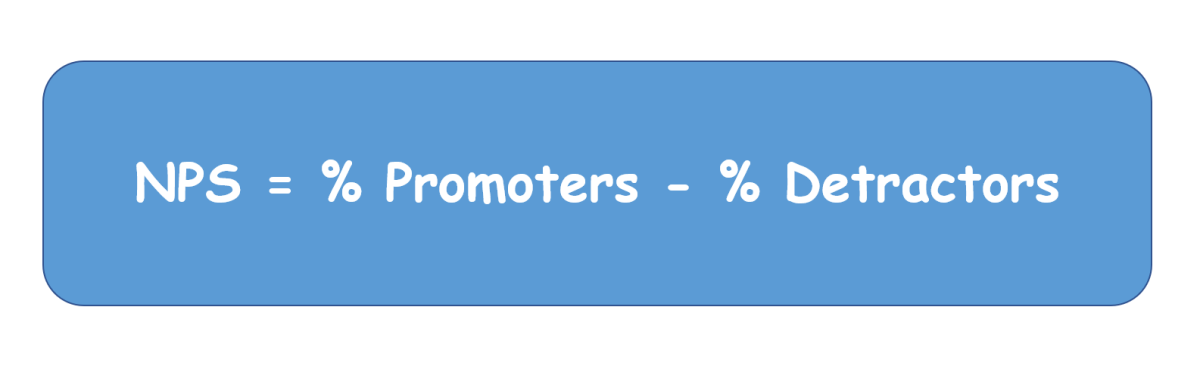
Example:
Your NPS survey finds:
- Promoters: 80%
- Detractors: 20%
NPS = Promoters (80%) – Detractors (20%)
= 60%
16. Website traffic
Website traffic measures total visitors over time. Higher traffic indicates greater awareness and engagement.
Example:
Monthly website visitors: 30,000
This shows strong traffic to the website, suggesting effective marketing.
17. Bounce rate
Bounce rate is the percentage of visitors who leave after viewing one page. Lower bounce signals better engagement.
Example:
Bounce rate: 70%
The high rate indicates potential issues with site content or user experience.
18. Email open rate
Open rate is the percentage of email subscribers who open a marketing message. Higher rates mean more interest.
Example:
Monthly email open rate: 25%
This suggests the business‘s emails are resonating with a quarter of their list.
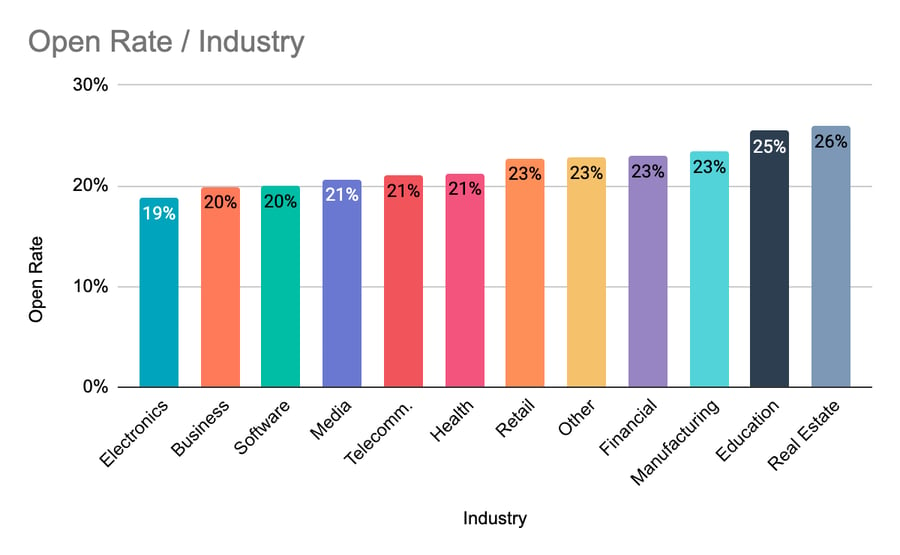
Figure 4: Average email open rate by industry (Source: Hubspot)
19. Social media engagement
Engagement analyzes likes, shares, and comments on social posts. Higher engagement means greater brand awareness.
Example:
Average Instagram post gets 500 likes, 50 comments, and 20 shares.
This shows strong social media engagement for the business.
20. Mobile conversion rate
Measures the percentage of mobile visitors who convert. Can compare to desktop rates to identify issues.
Example:
Mobile conversion rate: 3%
Desktop rate: 5%
The lower mobile rate indicates issues with the mobile experience.
Conclusion
Tracking the right ecommerce KPIs provides invaluable data, insights, and visibility into overall business performance. It enables online retailers to identify high-impact areas for improvement, optimize operational efficiency, and make smart investments for growth.
While measuring KPIs can be challenging, leveraging an end-to-end ecommerce analytics platform streamlines the process through automated data collection, consolidation, monitoring, and reporting.
Focusing on the 18 KPIs highlighted in this guide will help ecommerce businesses master performance measurement, gain a competitive edge, and build resilience to navigate the current challenging landscape.